Analyzing India's numbers while batting first ahead of the upcoming ODIs against Sri Lanka
In this article, we’ll focus on India’s numbers while batting first only, try to identify areas and phases of play that India as a team need to work on, and look at the players who can potentially do those jobs.
9 Min Read

The chat around some countries potentially fielding two international teams at the same time has been going on for quite a while now. This summer has seen that chat turn into reality as England and India have both managed to put together two completely separate squads for two different series each. While England have tasted massive success sweeping Pakistan 3–0 with their second-string side, India are about to start their journey with a second-string side of their own in Sri Lanka from July 18.
First up will be the ODI series starting on 18th July at the R. Premadasa Stadium in Colombo. As a new, albeit temporary chapter unfolds in Indian cricket under the leadership of Shikhar Dhawan and Rahul Dravid, let’s try to look at some numbers and trends regarding India’s batting in ODIs, post the 2019 World Cup. In this article, we’ll focus on India’s numbers while batting first only, try to identify areas and phases of play that India as a team need to work on, and look at the players who can potentially do those jobs.
The general trend these days in limited-overs cricket is to win the toss and bowl first, and it’s been rather successful as well. Since the 2019 World Cup, teams have won the toss and decided to field in 53.4% of all ODIs, winning 64.1% of those games. Whereas the games in which teams have decided to bat have been won only 55.9% of the time. India meanwhile, have not been completely floored by the bowl first strategy.
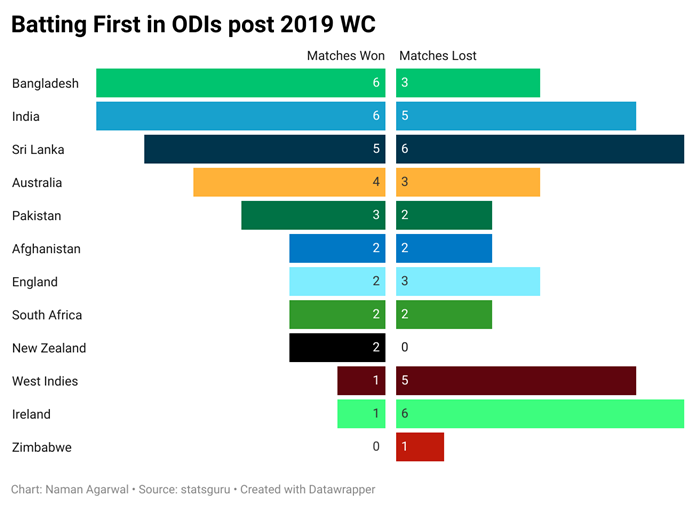
They have won only 4 tosses out of the 17 completed ODIs they’ve played in this period, deciding to bat in three of those, winning two and losing one. Here’s the overall breakdown of India’s performances while batting first post the 2019 World Cup, compared to all other Test-playing nations.
India have won 6 out of the 11 games in which they’ve batted first since the 2019 World Cup, joint-most alongside Bangladesh, while facing higher quality opposition than Bangladesh. England surprisingly haven’t been that great at setting up and defending totals, having lost 3 of the 5 games in which they’ve batted first in this period. The team India will be up against meanwhile, Sri Lanka, have a mirror image of a record as compared to India, having won 5 and lost 6 of the games in which they batted first.
There has been a lot of criticism for India’s safety-first approach while starting the innings as opposed to say, England’s flamboyant, relentlessly attacking approach. But as you can see above, the numbers tell a different story. Despite the said conservative approach, India average 327 in wins, and 306 in losses — 2nd highest and highest respectively — since the 2019 World Cup. While India’s approach is definitely less attractive than England’s, it is an approach that is tailored to their strengths, and most importantly, is bringing them results.
While the high average scores do speak of the happy template which India have set for themselves, the high average score in losses also speaks of something else. India are the only team to have an average score above 300 in losses. And it’s not as if they’ve lost 1–2 games. They’ve lost 5 matches where they’ve averaged 306 runs in the first innings. This shows that there are obvious issues with the bowling which need to be worked on and sorted.
Let’s now dive deeper and breakdown India’s innings while batting first since the 2019 World Cup, into phases of 10 overs each and see how they’ve been performing on different metrics so as to look for potential areas of improvement which can be focused on in the three upcoming games against Sri Lanka.
Run Rate
The chart below shows the phase-wise run rate of India in wins and losses while batting first in ODIs since the 2019 World Cup.
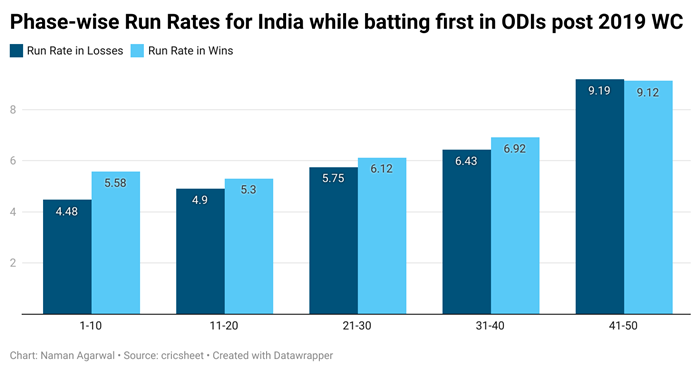
At first glance, you can observe that the scoring rates are higher in all phases except the last (41–50), in wins. The difference is most profound in the first 10 overs, where India have scored at 4.48 runs per over in matches they’ve lost, and a whopping 1.1 runs per over higher in matches they’ve won. This rate of 5.58 runs per over is the third-highest among all teams in the first powerplay while batting first and winning, only behind Sri Lanka(5.98) and Afghanistan(5.95).
This is one of the primary areas India should and will look to work on in the upcoming series. While Rohit Sharma and Shikhar Dhawan are the first choice openers in ODIs, this will be a chance for someone like Prithvi Shaw to provide India with a dynamic option at the top, who can go hard from ball one, and cement his place as the back-up opener whose starts will be anything but conservative.
The middle overs, consisting of three phases, 11–20, 21–30, and 31–40, will also be an area where India should look to keep the scoreboard ticking. There’s a difference of almost 0.5 runs per over in each of these three phases between wins and losses, which although not much, can turn out to be match-defining by the end.
Balls Per Boundary
The next chart shows the phase-wise balls per boundary for India in ODIs since the 2019 World Cup. This will provide a deeper insight into how and why the phase-wise run rates are what they are.
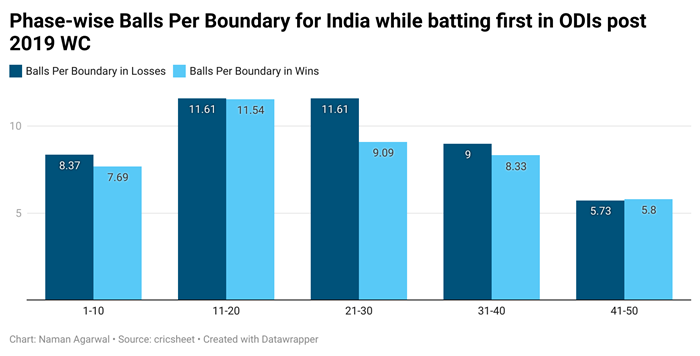
The most striking observation here is the difference in Balls per Boundary in the 21–30 over phase. This is primarily because if and when India lose early wickets, or a cluster of wickets in the middle, quite naturally, they go into a shell and try to rebuild instead of taking the more adventurous, counter-attacking way out.
Despite this though, they are well below the average balls per boundary of all teams in this phase in losses, which is 13.59. Also, they are the only team to have a single-digit balls per boundary in the 21–30 phase in wins. Next best is South Africa, who hit a boundary every 10 balls in this phase. If you can manage such numbers while being perceived and labelled as ‘conservative’, good luck to the other teams.
If anything, India can try to work on taking that odd extra risk in the 31–40 over phase. South Africa and Australia have balls per boundaries of 7.5 and 6.5 respectively in this phase, in wins. This is the last phase with four fielders outside the 30-yard circle and can provide teams the launchpad to go big in the last 10. If timed perfectly, attacking in this phase can send the fielding captain’s plans into disarray, making him bring back his strike bowlers earlier than he’d like and if they are played out well enough, it provides the opportunity for the batsmen to cash in even more towards the last few overs.
The Pandya brothers and whoever of Sanju Samson and Ishan Kishan plays at 5, will have the responsibility and opportunity, of taking the game by the scruff of its neck in this phase and stamping their authority. And the kind of batsmen all of them are, you can expect India’s balls per boundary to come down in the 31–40 over phase in this series.
Balls Per Wicket
The following chart shows the phase-wise Balls per Wicket for India in ODIs since the 2019 World Cup. And nothing epitomizes India’s ‘conservative’ approach better than this chart.
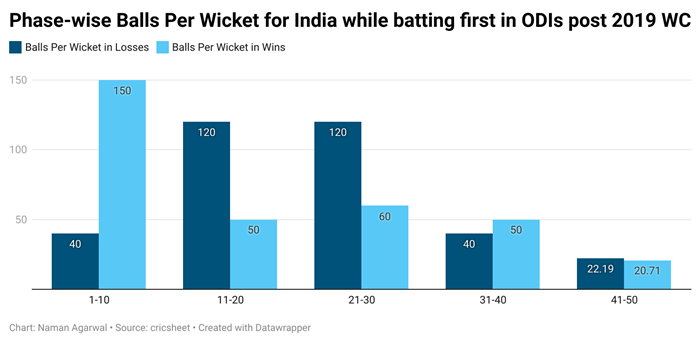
India have lost early wickets in matches which they’ve lost, while they have rarely lost any wicket in the Powerplay in matches which they’ve won. Hence the stark difference between the two bars in the 1–10 phase. Those early wickets have activated India’s safety first, low-risk strategy, which is reflected in the high balls per wickets in the 11–20 and 21–30 over phase. And that is precisely where they’ve started to fall behind in the game.
This should give them an indication as to how to plan their innings better. They need to cut down on the duration of the consolidation, low-risk phase, and limit it to perhaps one chunk of 10 overs and not two, and start taking the occasional risk as soon as they feel settled on the crease.
Suryakumar Yadav and Manish Pandey will most probably occupy the 3rd and 4th positions and will need to make sure that no matter the situation, they don’t go into a shell, and keep the scoreboard ticking. Whoever does it better, will probably have a better chance of travelling with the first choice team as the backup middle order bat in the future.
This series is going to be fascinating for various reasons, the most obvious of which is the number of newcomers and players who’ve been on the fringe with the first choice team for so long, getting an opportunity. The first choice team in ODIs for India is relatively settled in terms of batting, with only a couple of backup options and some minor areas of improvement as mentioned above, required. India’s squad is big, and the number of places up for grabs, small. Sri Lanka will do well to make this series a competition between two teams, rather than a competition within one.
Get every cricket updates! Follow Us:
Download Our App