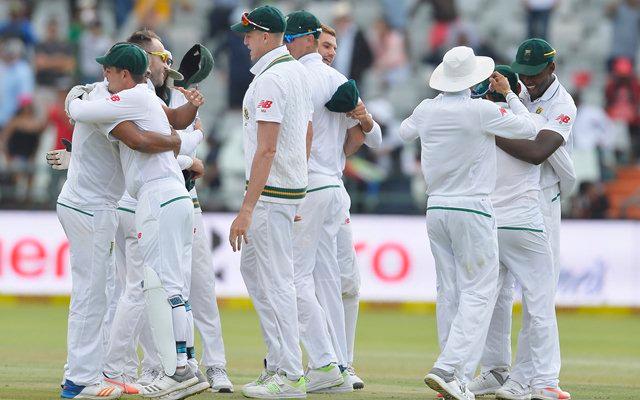
South Africa vs India, 2018: 1st Test, Day 4 – Statistical Highlights
All the stats and numbers that were recorded during South Africa’s victory.
View : 1.4K
2 Min Read


The rain on the 3rd day brought back life into the pitch as South Africa rolled over India to defend a mere 208-run total and take a 1-0 lead in the 3-match Test series. Indian pacers were on fire in the first session to bundle out the home side to just 130 in the 2nd innings. After losing a couple of early wickets, India managed to tire out the three pacers with a partnership building between Virat Kohli and Rohit Sharma. Just when the Saffers set to bring in a spinner, India lost Kohli’s wicket and a collapse carried on as they were bowled out for 135 from 71/3.
All the cricket stats and numbers that were recorded during South Africa’s victory:
1 – For the first time in Indian Test cricket history, four Indian pacers took at least three wickets in the same Test. This is also the first time where four pacers took a wicket in both the innings of a Test for India.
4 – Number of ducks for Faf du Plessis in the 12 Test innings against India. These are the joint most number of ducks for a South African against India in this format. Hashim Amla and Makhaya Ntini also bagged four ducks each against India.
10 – Wriddhiman Saha became the first Indian to affect ten dismissals in a Test match. (10 catches) MS Dhoni affected nine dismissals (8 catches, 1 stumping) in his last Test match in 2014 at the MCG. Saha also became the first Indian to hold on to nine and more catches in a Test match. Only four other players have taken as many as ten catches in a Test.
16 – The 16 catches held by Wriddhiman Saha and Quinton de Kock are the most by wicketkeepers in a Test match. 15 catches were taken by the wicketkeepers in four different Test matches.
37 – A total of 37 wickets went to the pace bowlers in this Test match which are the joint most in a Test match since 2012. The 2014 New Zealand-India Test match in Auckland also witnessed pacers taking 37 wickets.
78 – South Africa were bowled out for 130 in their second innings from 52/0. The 78 runs India needed for taking ten wickets are the joint 2nd fewest in an away Test match. India took Australia ten wickets for 72 runs in the 1981 Melbourne Test and England’s ten wickets for 78 runs in the 1971 Oval Test. (Both in the 2nd innings)
130 – South Africa’s total of 130/10 is their joint 2nd lowest 2nd innings total at home since their readmission to cricket in 1991. England bowled them out for 83/10 in the 2016 Johannesburg Test. South Africa posted 130/10 against Australia in 1997 also at Johannesburg.
208 – The 208-run target is the 3rd lowest while chasing in Test cricket in which India lost. India lost while chasing 120 in 1997 Bridgetown Test against Windies and 176 against Sri Lanka in the 2015 Galle Test.
416 – South Africa’s match aggregate of 416 runs is their highest at home and the 2nd highest overall in a won Test match since their readmission to cricket in 1991. They defeated Australia in 1994 Sydney Test with a match aggregate of 408 runs.
Download Our App