Who were the best batsmen in the World Test Championship 2019-21? - A data-driven analysis
We try to analyze and reach a conclusion as to who were the top five batsmen in the inaugural cycle of the WTC.
15 Min Read

267 half-centuries were scored in the World Test Championship. 49 batsmen crossed the three-figure mark, on 93 separate occasions. On 14 of those 93 occasions, they converted their centuries into double-centuries. And on one of those 14 occasions, a certain David Warner converted his double into a triple, becoming the first and only triple centurion in the World Test Championship.
Although the last few years have historically been the most difficult years for batting in Test cricket, as was further evidenced by the World Test Championship Final where the average runs per wicket was 24.25 and the average scoring rate touched historically low levels, there hasn’t been any dearth of memorable high-quality batting performances.
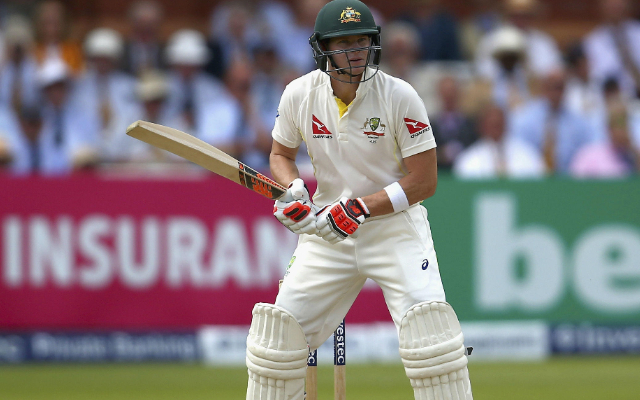
Be it Steve Smith’s emotional century on a comeback in the first Test of the WTC, or Ben Stokes’ herculean effort in ‘that’ Headingley Test. Be it Kane Williamson and Joe Root’s twin double centuries, or Kyle Mayers’ and Rishabh Pant’s fourth innings heroics in Chattogram, Sydney and Brisbane respectively. This World Test Championship saw enough such instances of individual batting brilliance to have a book written about them.
One thing that is difficult to gauge in this WTC though, is overall batting performances, because of the uneven and asymmetric nature of the fixtures. Hence, we decided to get down and find a solution to this. As the World Test Championship has come to an end, with New Zealand triumphing over India in a fairytale finish, we try to analyze and reach a conclusion as to who were the top five batsmen in the inaugural cycle of the WTC.
The Factors
The factors taken into account for this analysis have been described below.
Runs Scored
The most obvious metric to take into consideration while doing any batting-related analysis, especially in the longest format, is the number of runs scored. Although there was an uneven distribution of matches and the absolute number of runs scored would be vastly different for batmen from England and say batsmen from New Zealand, we had to factor that in and give some weightage to the runs scored in a manner that doesn’t skew the results in the favor of batsmen who played more matches, and hence scored more runs.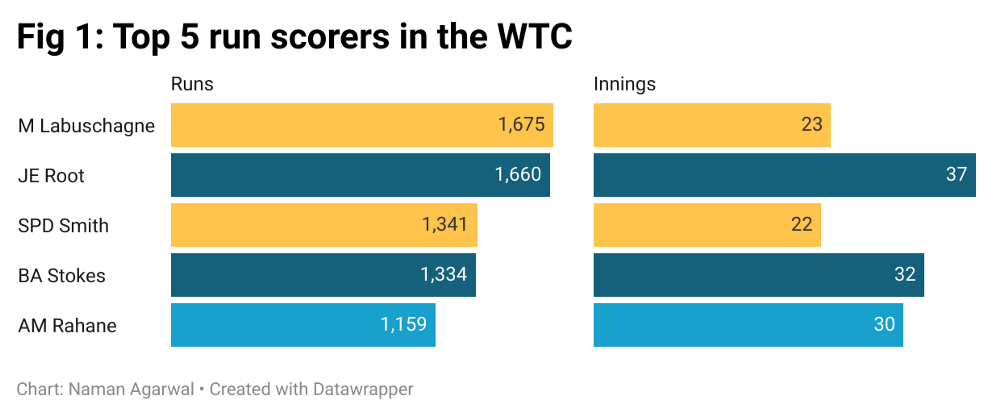
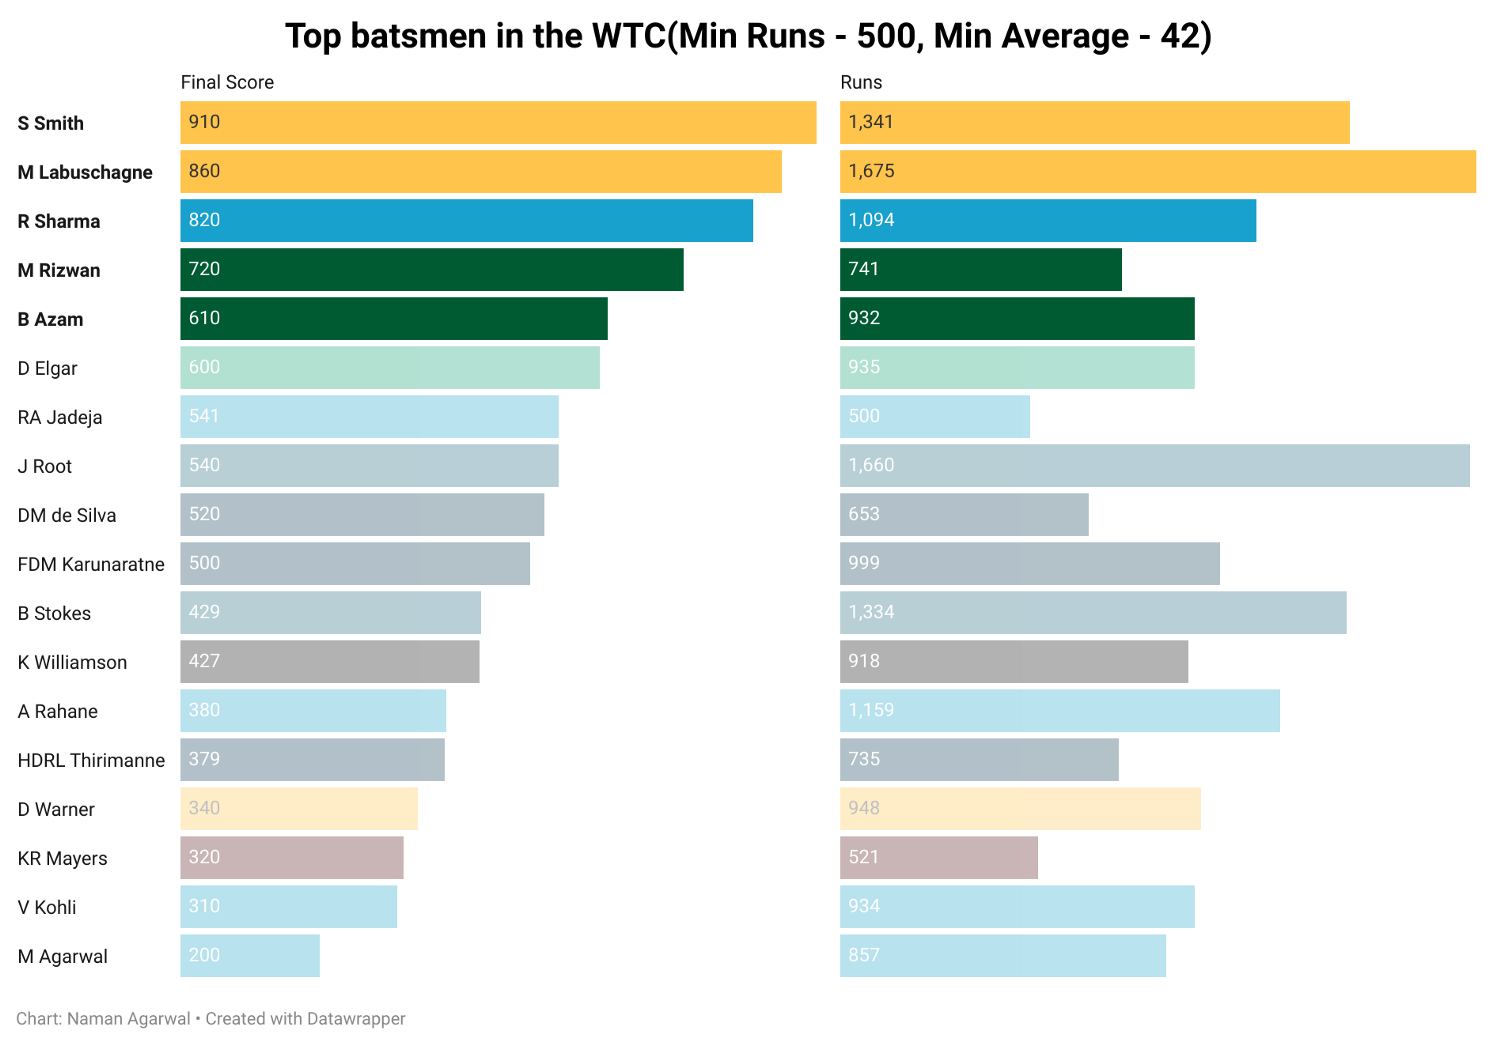
Fig 1 shows the top 5 run-getters of the WTC
Weighted Batting Average
The second most obvious metric to consider while doing batting-related analysis is generally the batting average. But there are certain issues with the traditional batting average. It inflates the average of batsmen coming down the order and thus having more not-outs, sometimes to certain unrealistic levels. Also, it doesn’t really take anything other than the volume of runs scored into account.
This is where the Weighted Batting Average comes in handy. What it does is, gives context to the averages by scaling each innings to the average of the rest of the team in that innings, excluding the contributions of the batsman in question. Let’s understand how it works using a simple example.
Suppose batsman ‘A’ scored [25, 133, 47] in three innings of a series. The average of the rest of the team in those three innings were [32, 24, 29] respectively. His traditional average would stand at [(25+133+47)/3] = 68.33.
But for calculating his weighted average, we’ll scale both the numerator and denominator by the average of the rest of his team.
Numerator = [25/32 + 133/24 + 47/29] = 7.94.
Denominator = [1/32 + 1/24 + 1/29] = 0.11.
Dividing the numerator by the denominator gives us a weighted average of 74.03, 5.7 runs higher than the traditional average. And this makes intuitive sense as well if you look at the batsman’s scores. His two bigger scores came when the average of the rest of his team was low. So ideally those innings should hold more value rather than an innings of say 75 when the rest of the team itself averages more than 60. And that is what the Weighted Average provides – context.
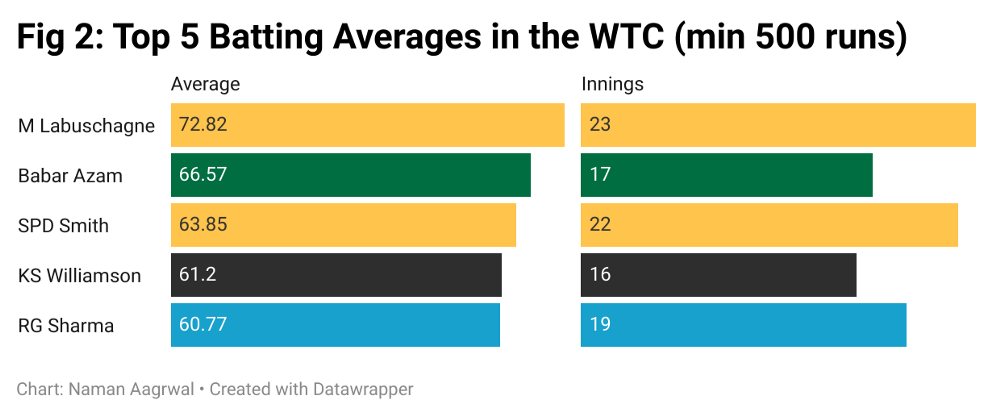
Fig 2 shows the top 5 batsmen with the highest averages in the WTC
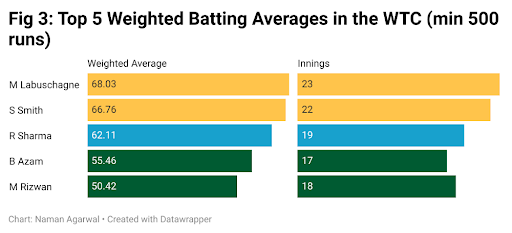
Fig 3 shows the top 5 batsmen with the highest weighted batting averages in the WTC
Difference between Actual Average and Weighted Average
While the Weighted Average does provide context to each innings, it is best used in comparison to the actual averages. We simply subtract the actual average from the weighted average to see if the result is positive or negative.
A positive result implies that the batsman generally scored big when others in his team didn’t. Telling us that he has been the crisis man for his team, scoring in difficult conditions for batting and against tough bowling attacks (as the rest of his team didn’t score much).
Similarly, a negative result implies that the batsman’s bigger scores generally came in innings where others in his teams scored big as well, telling us that while he does well in conditions that are relatively easy for batting (as the rest of his team scored big too), he might not be that reliable in tougher assignments.
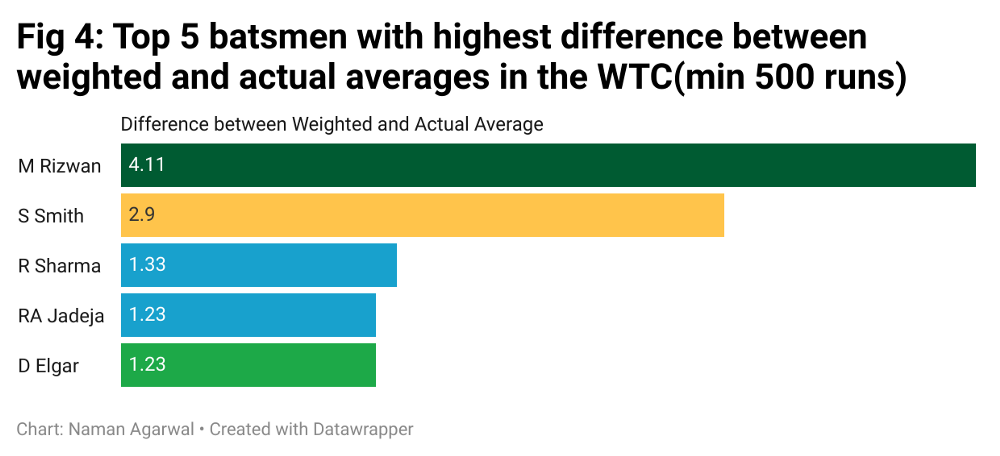
Fig 4 shows the top 5 batsmen with the highest difference between actual average and weighted average in the WTC.
Consistency
One thing which gets talked about a lot while evaluating batsmen, but doesn’t always get quantified and actually used in evaluating them, is consistency. The importance and relevance of consistency are well understood. You would prefer a batsman who consistently gets around 50 runs in each innings over a batsman who is more of a hit or miss kind, getting out early, or going big. While there may be schools of thought which might prefer the second type of batsmen, for the sake of this analysis, we’ve limited ourselves to simply rewarding consistency.
So how did we evaluate consistency? Nothing fancy. We simply calculated the standard deviation of runs scored in each innings for each batsman. That gave us a value for each batsman signifying how much his scores varied from the mean of his scores.
Greater the value → Greater the variance → Lower the consistency.
Then we divided this value by the actual averages of the batsmen so that they can be compared, arriving at the consistency index. Lower the Consistency Index, the more consistent the batsman. 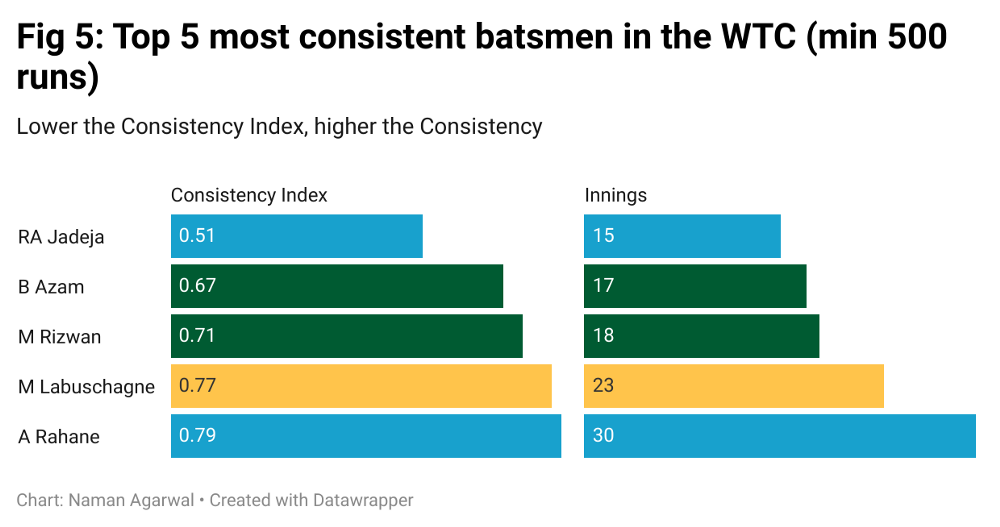
Fig 5 shows the 5 most consistent batsmen in the WTC.
The Algorithm
Now that we’ve covered all the factors taken into consideration, let’s look at the actual algorithm which we used to get the final results.
Elimination based on median and mean values
A total of 206 batsmen batted in the World Test Championship. Among them, many were bowlers or batsmen who played very few numbers of games. So, the first thing we did, made some eliminations based on certain metrics to arrive at a more concise, trimmed-down list of batsmen.
The first elimination was done on the basis of number of innings played. We took only those batsmen who had played more than 10 innings, shortening our list of batsmen from 206 to 96.
Next, we eliminated on the basis of Weighted Average and Average on the basis of their median and mean values respectively. The median value for Weighted Average was 26.91 while the mean value of Average was 41.22. This is pretty intuitive, as you’d not expect any of the top 5 batsmen to average below 40 anyway unless of course all matches of the Championship were played in conditions in which the Final was. At this stage, we had a pretty short and crisp list of 19 batsmen, on which we applied one final filter — a minimum of 500 runs, which eliminated Mushfiqur Rahim.
Normalization of values
Now that we had a final list of 19 batsmen to work with, this is where the crux of the algorithm started getting applied. Our next step was normalizing the values we needed for evaluation.
The need for normalization stems from the fact that the four values which we eventually used for every batsman — runs scored, weighted average, the difference between actual and weighted average, and consistency index, were all in different scales. While the weighted averages ranged from 27.48 to 68.03, the differences ranged from -15.36 to 4.11, and the consistency indices ranged from 0.51 to 1.61.
We needed to bring these values to the same scale, which we did by simply dividing each term by its maximum value among all batsmen for runs, weighted average, and the difference between weighted and actual average.
While for consistency index, we divided the minimum value among all batsmen by the individual value of each batsman, since we wanted to give the lowest consistency index the highest value, i.e., 1, and vice-versa. This process ensured that the best values for each metric became 1, and got progressively worse as the values worsened (lowered for runs, WBA, and the difference between WBA and traditional average, increased for Consistency Index).
Assigning weights to each factor
With everything we required at our disposal, the final step remaining was to assign weights to each factor and calculate the final score for each batsman with which we could quantify the top 5.
These were the final weights given to each factor:
- Weighted Batting Average — 75%
- Difference between Weighted and Actual average — 5%
- Consistency — 10%
- Runs Scored — 10%
As mentioned earlier, we had to give some weightage to runs, but be careful that it doesn’t skew the results in favor of batsmen who played more matches. As for the difference between weighted and actual averages, again we had to give it some weightage, but ensure that batsmen having a significantly negative difference, yet having a weighted average much higher than others didn’t get penalized much.
And as for consistency, the reasoning behind giving it the same weightage as runs scored was that as much as we wanted to reward being consistent, we didn’t want a scenario where a player who makes consistent 35s ends up higher than a player who averages in the 60s while being a tad inconsistent.
Now that everything ranging from the ingredients to the recipe have been explained in detail, let’s get our hands on the dish and look at the final result.
The Results
5. Babar Azam
Pakistan had a torrid time in the World Test Championship, finishing 6th, having won only 43.3% of the points that were available to them. But Babar Azam stood tall amidst the ruins, ending up as their highest scorer in the Championship, by a fair margin. He absolutely dominated the weak attacks of Bangladesh and Sri Lanka at home, but the highlight of his campaign came in Australia, where he scored a fine second innings hundred at the Gabba, albeit in a losing cause, and then followed it up with a 97 in Adelaide. He had a decent tour of England as well, scoring two fifties there.
He was also the second most consistent batsman in the tournament after Ravindra Jadeja, while scoring almost twice as many runs as him. What went slightly against Babar was the fact that most of his big scores barring the ones in Australia, came against weaker attacks and in good conditions for batting, which pushed his weighted average down by a significant margin.
Runs – 932, Innings – 17, Average – 66.57, Weighted Average – 55.46,
Difference: -11.11, 50s – 5, 100s – 4, Consistency Index – 0.67,
Final Score: 610
4. Mohammad Rizwan
Rizwan finished as Pakistan’s third-highest scorer in the World Test Championship after Babar Azam and Azhar Ali. They had one of the toughest overseas assignments among all teams – touring England, New Zealand, and Australia – and Rizwan scored runs everywhere, with a 95 at the Gabba, 2 fifties in England, and 3 in New Zealand. He also scored his maiden Test century against South Africa in the 2nd innings of the Rawalpindi Test.
Rizwan topped the chart in terms of the difference between actual and weighted average and came third in terms of consistency. It shows how he scored runs in crunch situations when batting was difficult, and as if that was not enough, he did so with unmatched consistency. And this is why he slots in ahead of his captain at number 4.
Runs – 741, Innings – 18, Average – 46.31, Weighted Average – 50.42,
Difference: 4.11, 50s – 6, 100s – 1, Consistency Index – 0.71,
Final Score: 720
3. Rohit Sharma
The enigma of Rohit Sharma – the Test cricketer, had been one of the most frustrating stories in modern-day Indian cricket, until now. Rohit finally came good as he made the shift to the top of the order in the longest format, ending up as India’s second-highest run-scorer after Ajinkya Rahane, and with by far the highest average among all Indian batsmen in the World Test Championship.
Three of his four centuries in the tournament came in his first series as an opener, against South Africa. But the most impactful knock of his came against England on the dustbowl of Chennai. That knock of 161, coupled with his other knocks in that series and the solid starts he gave in Australia as well as the WTC Final, meant his weighted average ended up higher than his actual average. Consistency was an issue though, as he slots in at number 11 among the top 18 batsmen in the Championship, but it’s safe to say he was India’s best batsman in the inaugural World Test Championship, something you’d not have guessed when it began.
Runs –1094, Innings – 19, Average – 60.78, Weighted Average – 62.11,
Difference: 1.33, 50s – 2, 100s – 4, 200s – 1, Consistency Index – 1.04,
Final Score: 820
2. Marnus Labuschagne

Australia narrowly missed out on the WTC Final berth, finishing 3rd and having won 69.2% of points available to them. They unearthed a gem though, in the first series of the World Test Championship, in the form of Marnus Labuschagne. From coming on as the first concussion substitute in cricket to ending the inaugural World Test Championship as the highest run-scorer, Labuschagne could do nothing wrong.
He scored as many as 5 centuries, including a double ton against New Zealand in Sydney, and crossed 50 in 14 of his 23 innings. Let that sink in. The only reason he’s not at the top is that his weighted average took a slight hit, as several innings in which he scored big were in pretty flat conditions, where other Aussies scored decently as well. This by no means implies that he only scored when batting was easy, though. In terms of the sheer volume of runs scored, especially given the circumstances in which he started, you can easily consider him the best batsman of the tournament.
Runs– 1675, Innings– 23, Average –72.83, Weighted Average– 68.03,
Difference: minus 4.8, 50s– 9, 100s – 5, 200s– 1, Consistency Index– 0.77,
Final Score: 860
1. Steve Smith
Surprise, surprise, the best batsman of the inaugural World Test Championship was Steve Smith! You almost get a sense that no matter what factors you choose or what algorithm you apply, Steve Smith coming out on top of Test Batting charts will be as inevitable as the Sun rising from the East.
Smith was coming into the tournament off of the one-year ban post the Sandpaper-gate, and he announced his arrival like a king returning to his kingdom after years of exile. Like Rohit Sharma, Smith too scored 4 centuries, three of which came in one series – the 2019 Ashes, including one double century. He had a slightly dull period by his standards in the New Zealand series and the first half of the India series, but he came back strongly, scoring 131 and 81 against India in Sydney.
Even though his aggregate, weighted average, and consistency index are slightly lower than Labuschagne’s, he has a significantly positive difference between the weighted and actual average (2nd highest among all batsmen), which pushed him above Labuschagne.
Runs – 1341, Innings –22, Average– 63.86, Weighted Average– 66.76,
Difference: 2.9, 50s – 7, 100s – 4, 200s – 1, Consistency Index – 0.89,
Final Score: 910
Conclusion
The data for the analysis was taken from Statsguru, while the analysis was done in collaboration with Mr. Ruchir Jain, who’s a professional data analyst. Although our method might not be perfect, it sure is an improvement on simply evaluating batsmen based on runs scored, or batting average. Improvements can be made with this as well, going forward. There are more complicated methods to evaluate consistency that can be used, percentage contributions can also be taken into account. But we don’t expect the results to differ vastly.
– By Naman Agarwal
Get every cricket updates! Follow Us:
Download Our App