MS Dhoni IPL career stats year-wise: How MS Dhoni performed in IPL Explained
MS Dhoni has played all 18 seasons of the Indian Premier League (IPL).
12 Min Read
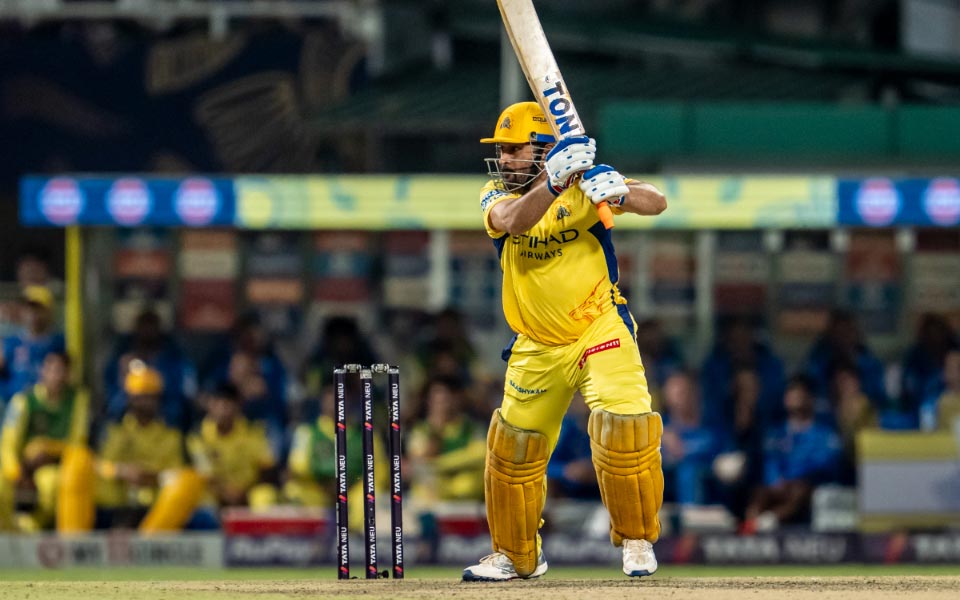

MS Dhoni is one of the few players who has played all 18 seasons of the Indian Premier League (IPL) since 2008. The 43-year-old has played 278 matches in the tournament in which he has scored 5439 runs at an average of 38.30 and a strike rate of 137.45, making him one of the legends of the tournament.
Dhoni was bought by the Chennai Super Kings in the IPL 2008 auction at INR 9.5 crore. Dhoni has also led the Yellow Brigade to five IPL titles and has played the majority of the seasons with them, apart from the 2016 and 2017 seasons, where he was bought by Rising Pune Supergiant (RPS) and led the side in the 2016 edition as well. The Pune franchise finished seventh on the points table in 2016 and made it into the finals of 2017. He is also the player who has played the most games as captain in the cash-rich league.
In the first five seasons of the tournament from 2008 to 2012, there was only one season where he failed to score 300+ runs. However, his average and strike rate still remained solid. The next three seasons from 2013-2015 were also productive and effective for the former India skipper. The 2013 edition was his best season in terms of runs where he scored 461 at an average of 41.90 and a strike rate of 162.89.
The 2016 and 2017 seasons were slightly underwhelming for the two-time world champion stumper-batter, but he managed to find his groove in 2018 and 2019. The seasons from 2020 to 2022 were slightly underwhelming again and though he was never amongst the runs in 2023 and 2024, he still managed to get some big hits and maintain a healthy strike rate in the tournament. The 2025 was one of the worst for him with the bat. Overall, the 2020s might be the lowest point of Dhoni’s IPL career.

[WATCH] MS Dhoni claims he is in last stage of his career
Here is Dhoni’s performance in each year of the IPL:
| Season |
Matches |
Runs |
Highest Score |
Average |
Strike Rate |
100s |
50s |
4s |
6s |
| 2008 |
16 |
414 |
65 |
41.40 |
133.54 |
0 |
2 |
38 |
15 |
| 2009 |
14 |
332 |
58 |
41.50 |
127.20 |
0 |
2 |
22 |
9 |
| 2010 |
13 |
287 |
66 |
31.88 |
136.66 |
0 |
2 |
26 |
8 |
| 2011 |
16 |
392 |
70 |
43.55 |
158.70 |
0 |
2 |
25 |
23 |
| 2012 |
19 |
358 |
51 |
29.83 |
128.77 |
0 |
1 |
26 |
9 |
| 2013 |
18 |
461 |
67 |
41.90 |
162.89 |
0 |
4 |
32 |
25 |
| 2014 |
16 |
371 |
57 |
74.20 |
148.40 |
0 |
1 |
22 |
20 |
| 2015 |
17 |
372 |
53 |
31.00 |
121.96 |
0 |
1 |
27 |
17 |
| 2016 |
14 |
284 |
64 |
40.57 |
135.23 |
0 |
1 |
18 |
14 |
| 2017 |
16 |
290 |
61 |
26.36 |
116.00 |
0 |
1 |
15 |
16 |
| 2018 |
16 |
455 |
79 |
75.83 |
150.66 |
0 |
3 |
24 |
30 |
| 2019 |
15 |
416 |
84 |
83.20 |
134.62 |
0 |
3 |
22 |
23 |
| 2020 |
14 |
200 |
47 |
25.00 |
116.27 |
0 |
0 |
16 |
7 |
| 2021 |
16 |
114 |
18 |
16.28 |
106.54 |
0 |
0 |
12 |
3 |
| 2022 |
14 |
232 |
50 |
33.14 |
123.40 |
0 |
1 |
21 |
10 |
| 2023 |
16 |
104 |
32 |
26.00 |
182.46 |
0 |
0 |
3 |
10 |
| 2024 |
14 |
161 |
37 |
53.67 |
220.55 |
0 |
0 |
14 |
13 |
| 2025 | 14 | 196 | 30 | 24.50 | 135.17 | 0 | 0 | 12 | 12 |
Get every cricket updates! Follow Us:
Download Our App